Vivian Duong
December 30, 2018
Predicting Housing Prices 02 Exploratory Data Analysis
import pandas as pd
import numpy as np
import seaborn as sns
import matplotlib.pyplot as plt
train = pd.read_pickle('../data/train.p')
Exploratory Data Analysis: Charts of Features v Target Variable
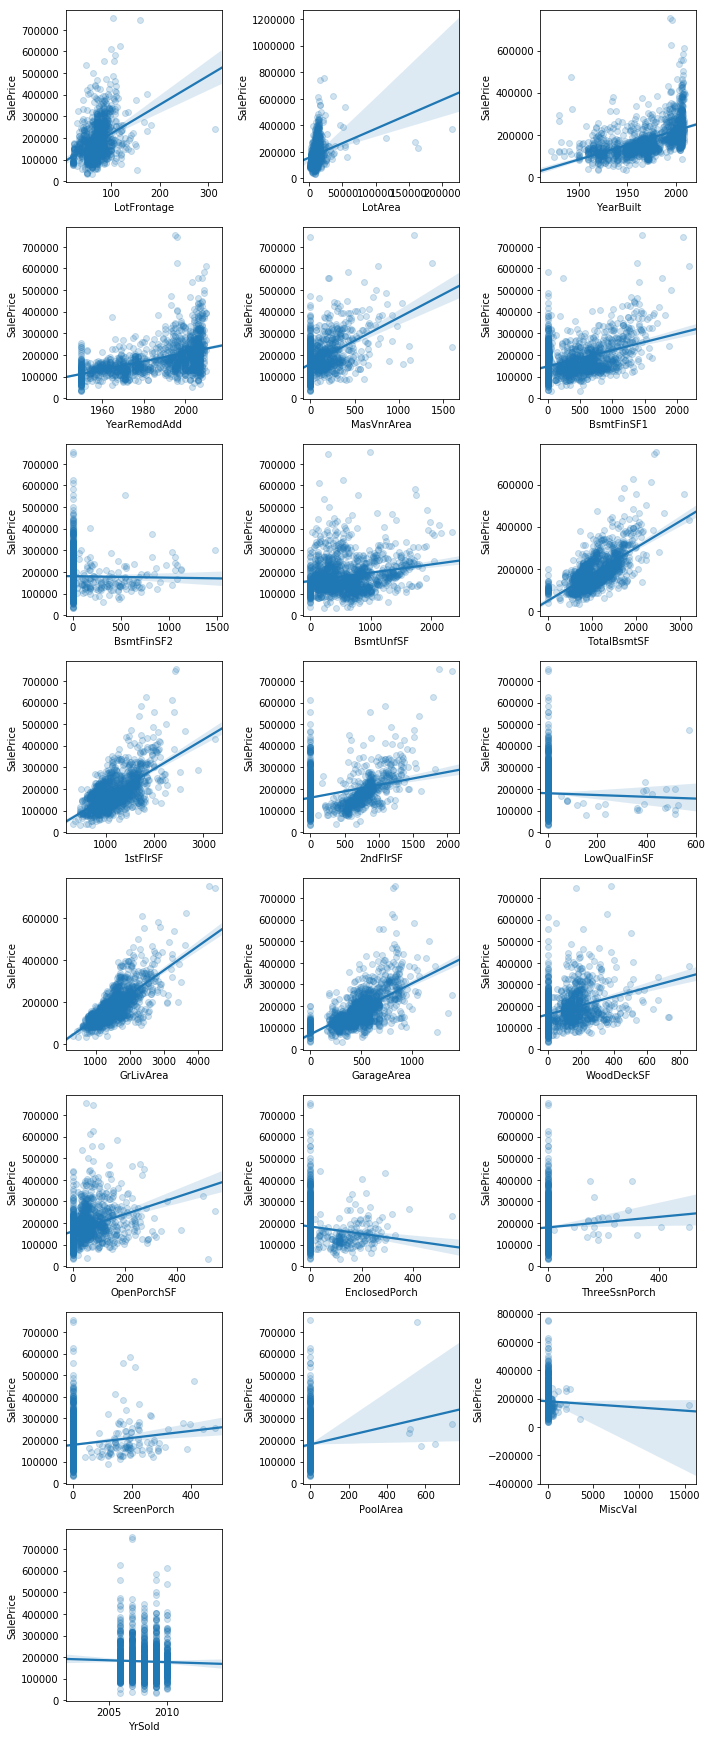
Scatter Plots of Numerical Features v SalePrice
is_dtype_num = train.dtypes.isin([np.dtype('float64'), np.dtype('int64')])
num_feats = train.dtypes.index[is_dtype_num]
fig = plt.figure(figsize=(10,60))
for i, col in enumerate([f for f in num_feats if not f == 'SalePrice']):
    fig.add_subplot(20,3,i+1)
    sns.regplot(col,
                train['SalePrice'],
                data=train,
                scatter_kws={'alpha': 0.2}
               )
fig.tight_layout()
C:\Users\HungFeb2016\Anaconda3\lib\site-packages\scipy\stats\stats.py:1706: FutureWarning: Using a non-tuple sequence for multidimensional indexing is deprecated; use `arr[tuple(seq)]` instead of `arr[seq]`. In the future this will be interpreted as an array index, `arr[np.array(seq)]`, which will result either in an error or a different result.
  return np.add.reduce(sorted[indexer] * weights, axis=axis) / sumval
Exploratory Data Analysis
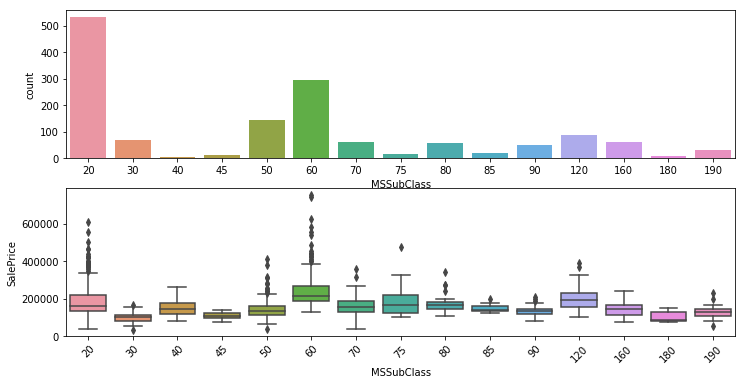
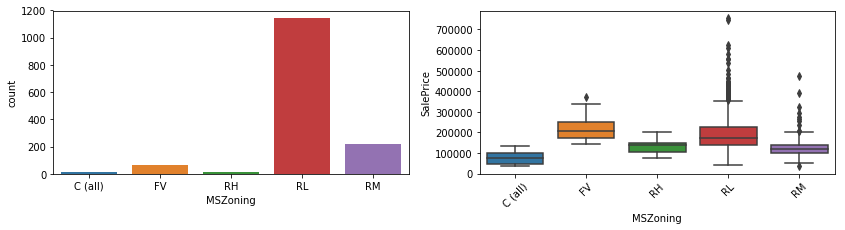
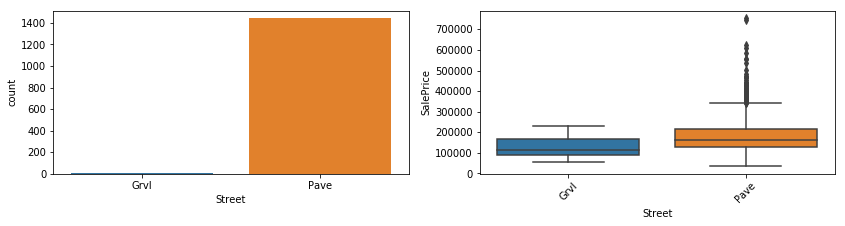
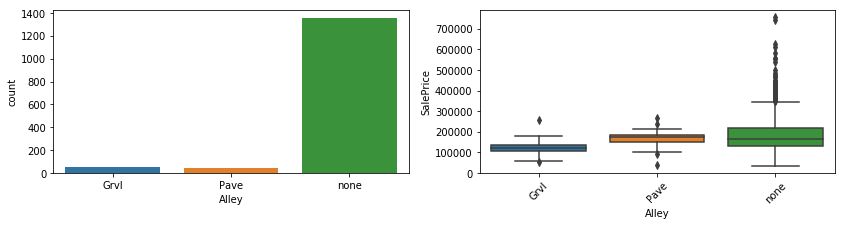
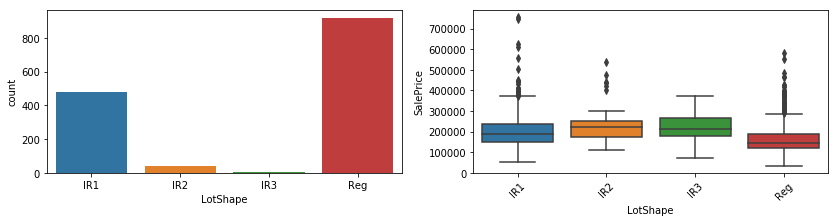
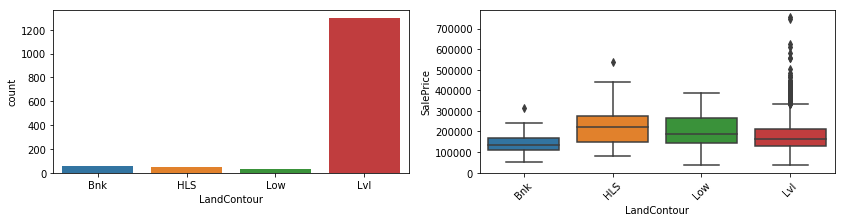
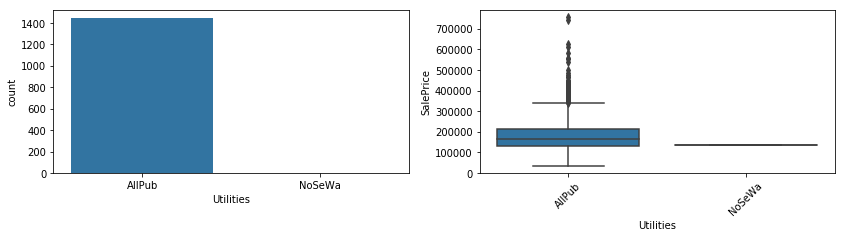
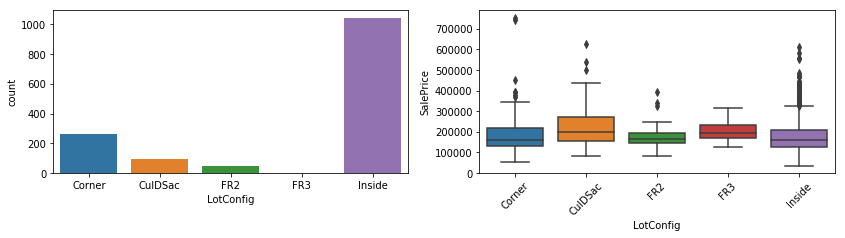
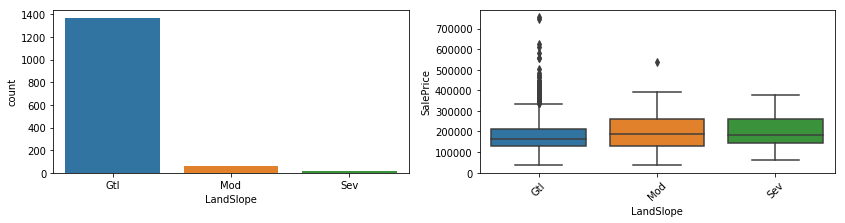
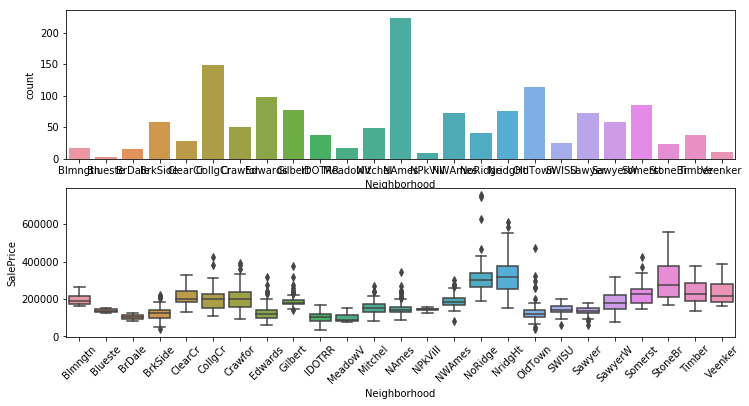
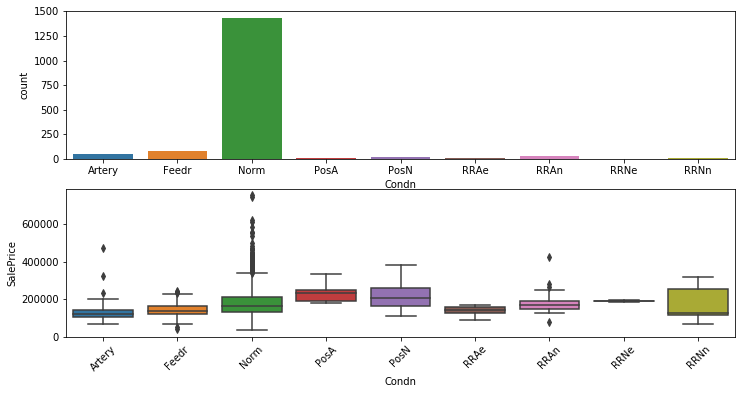
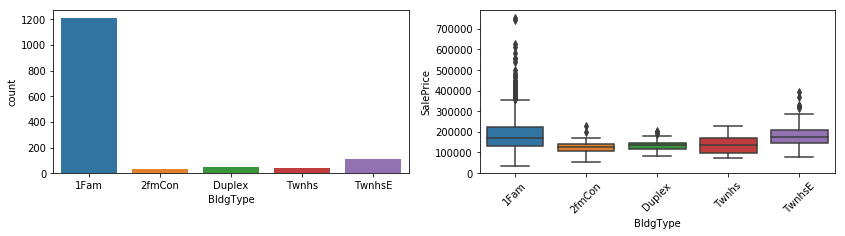
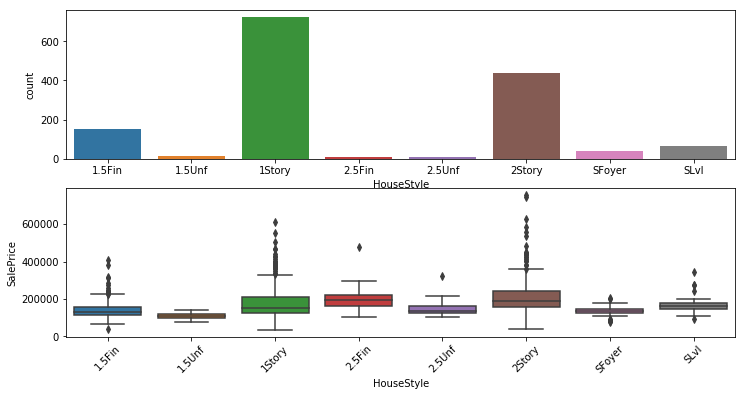
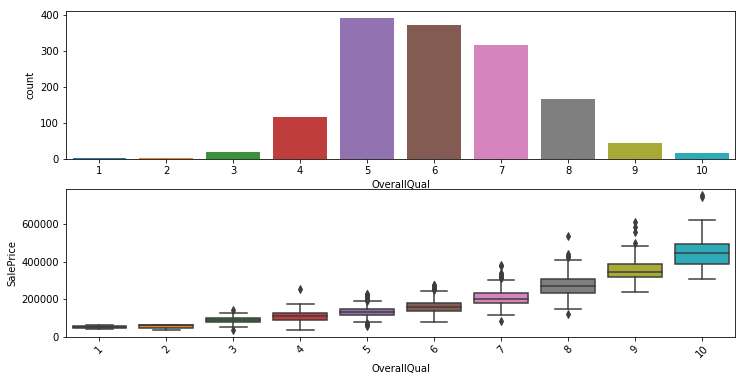
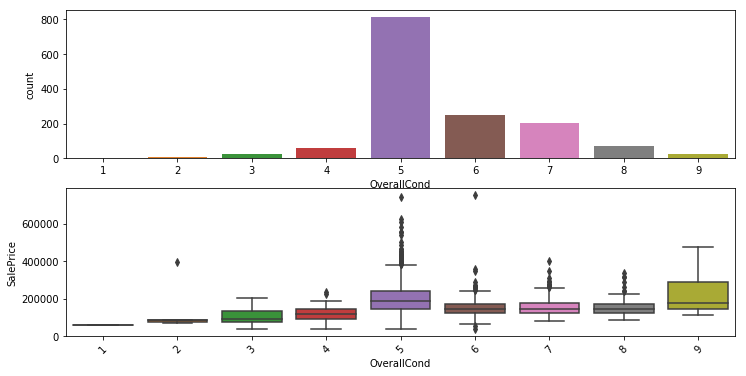
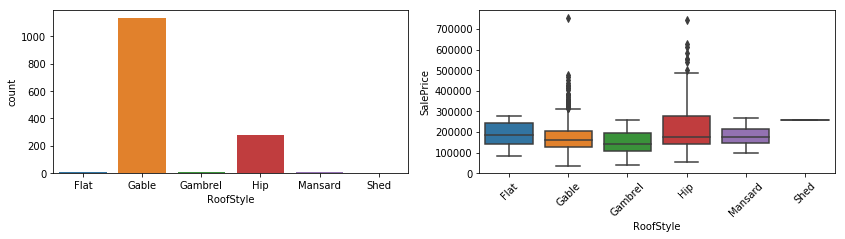
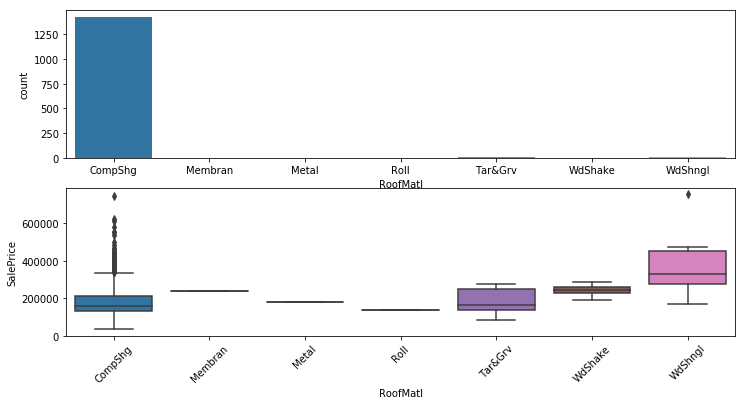
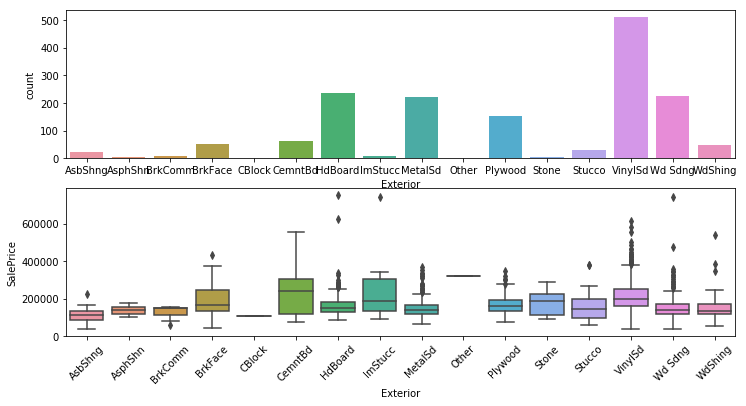
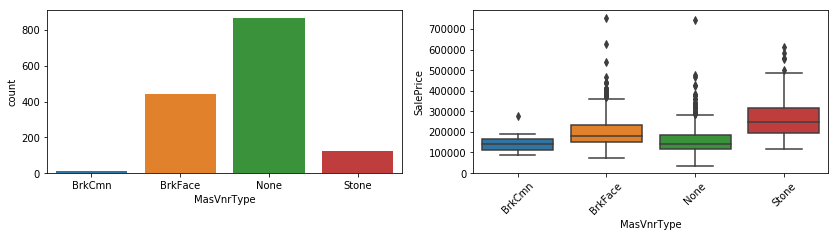
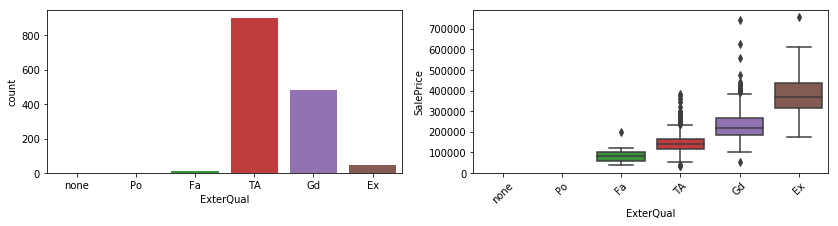
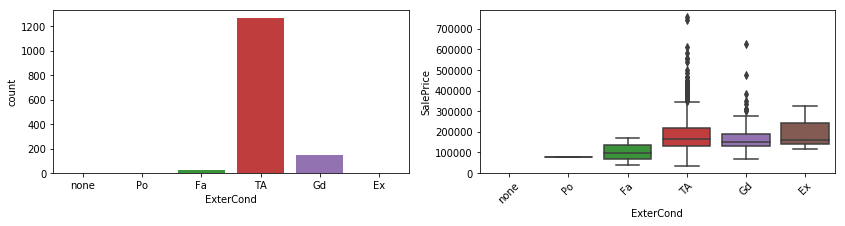
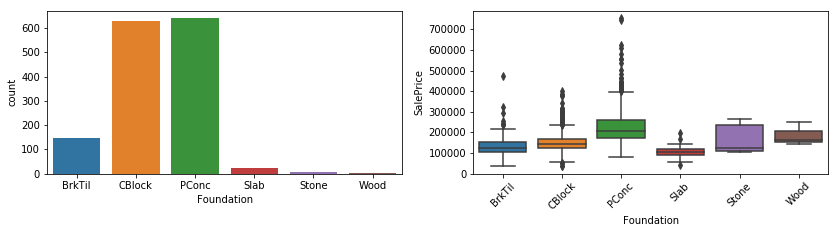
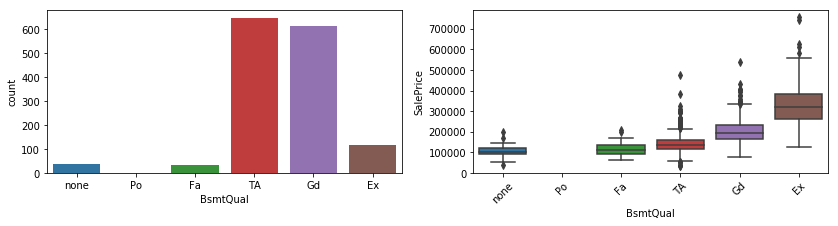
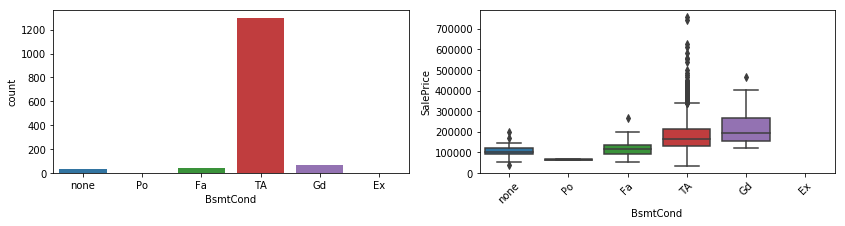
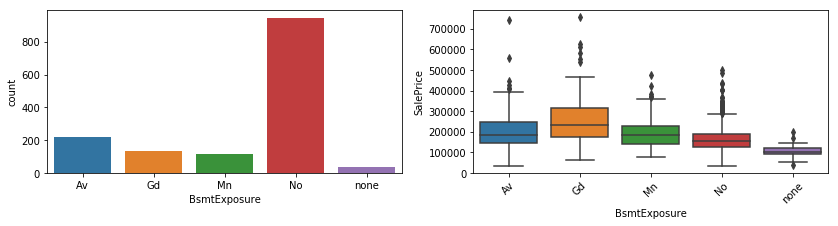
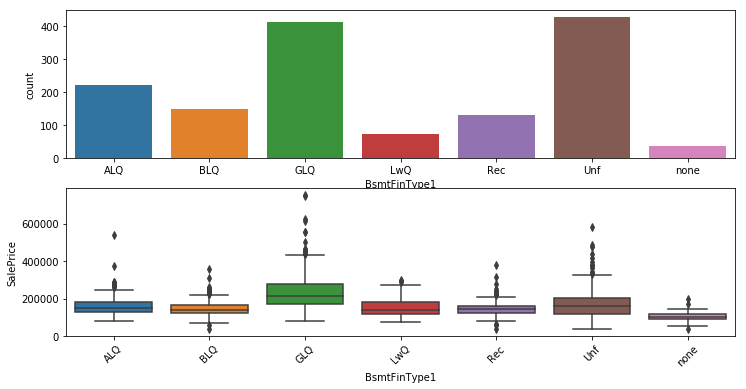
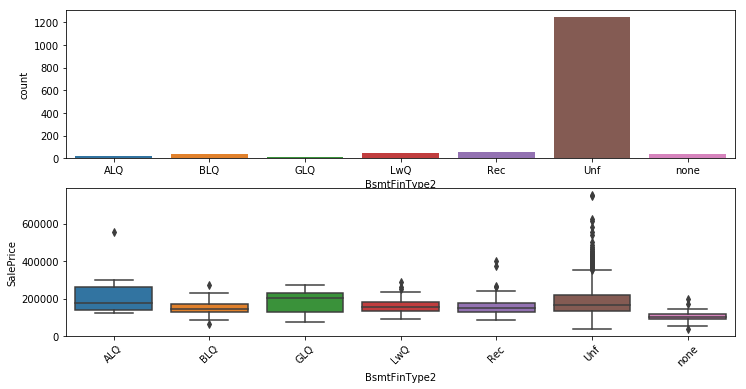
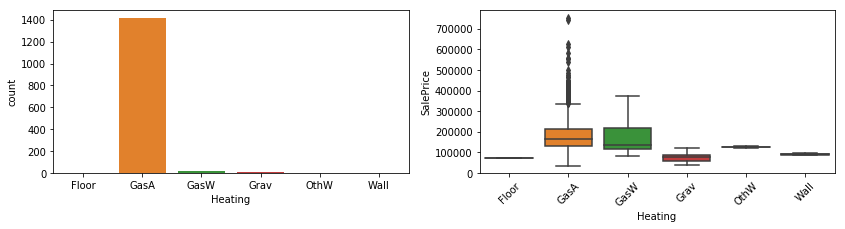
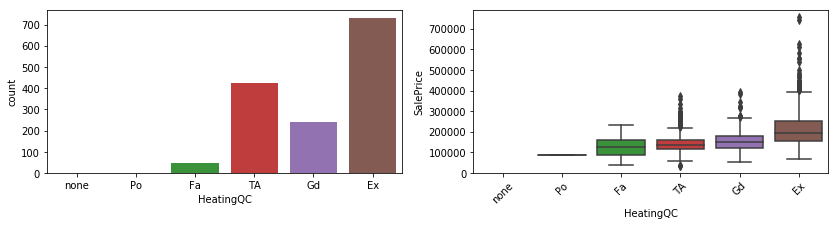
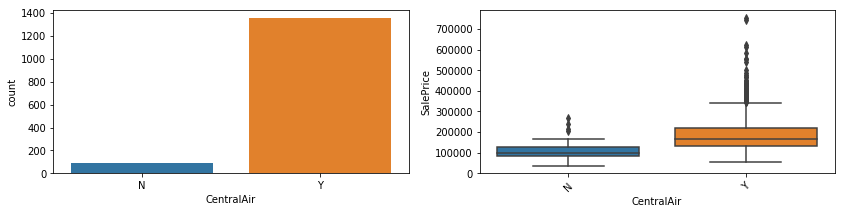
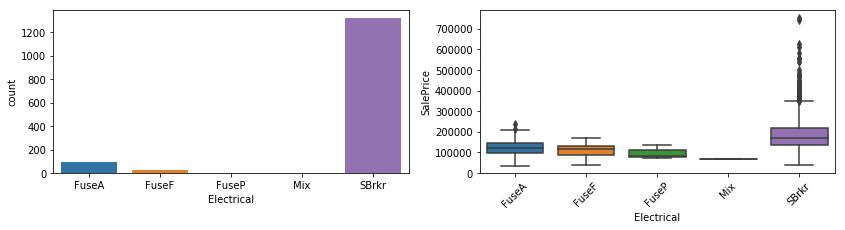
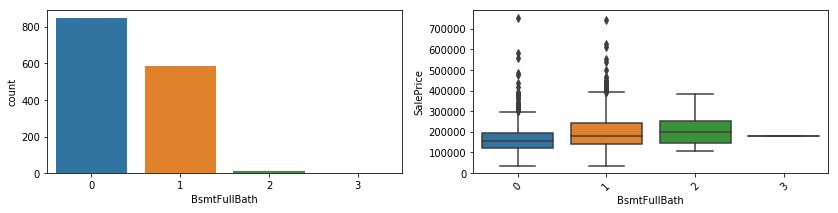
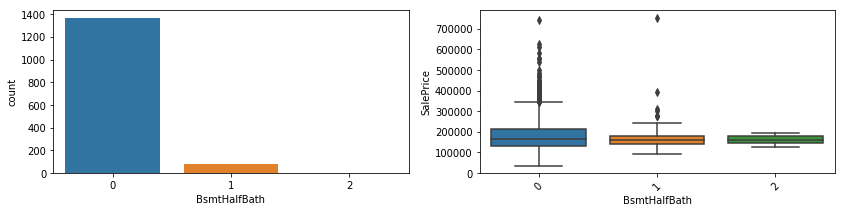
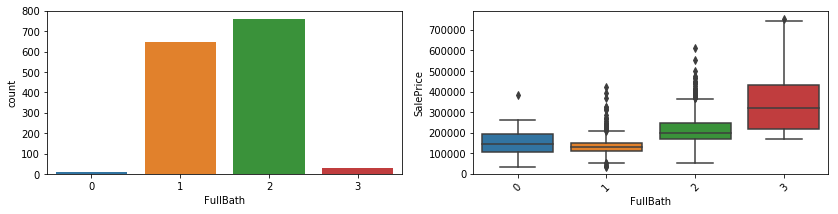
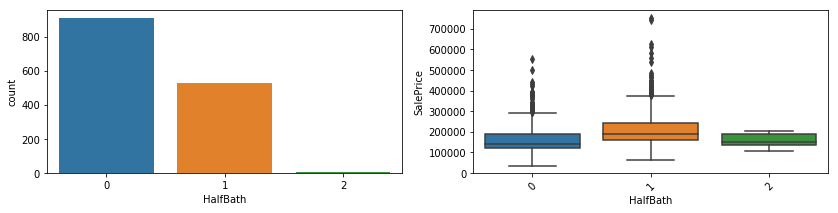
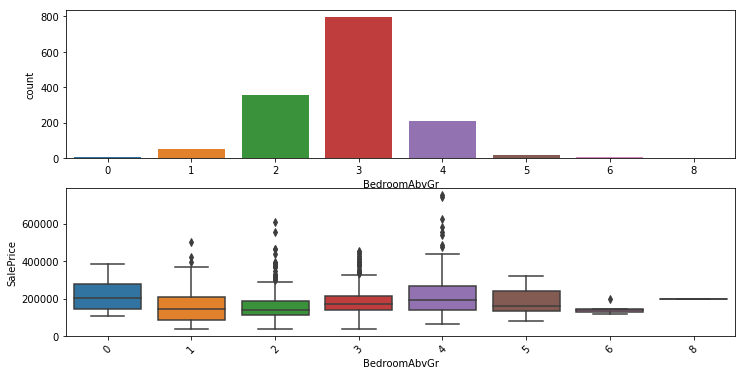
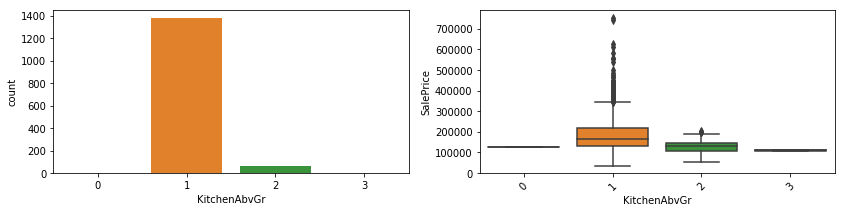
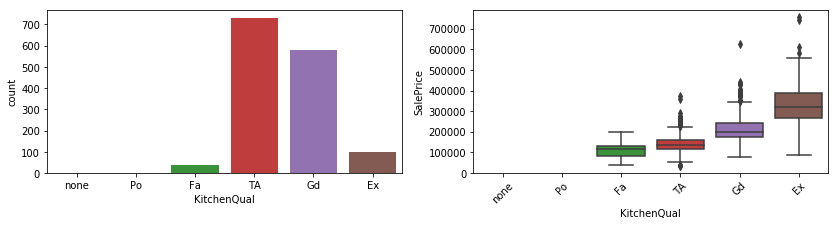
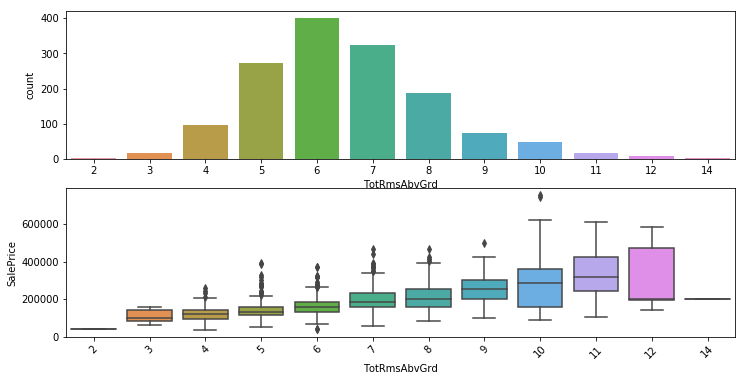
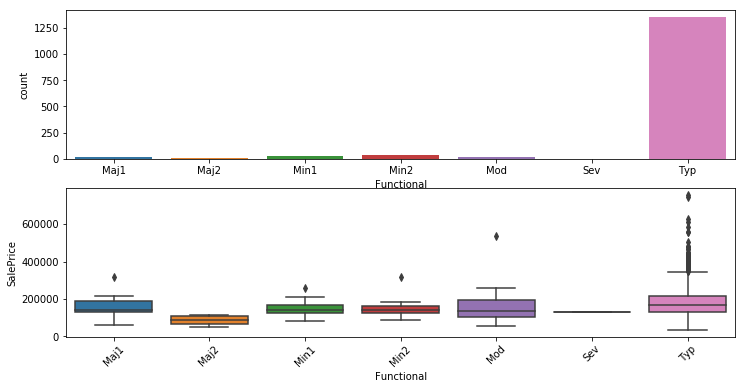
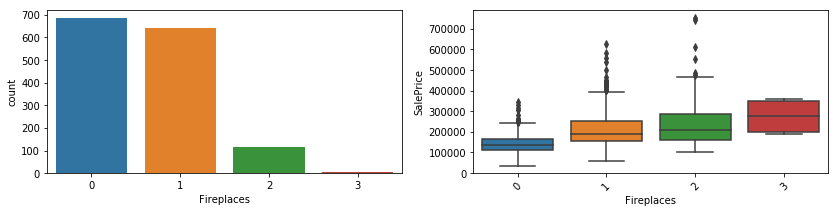
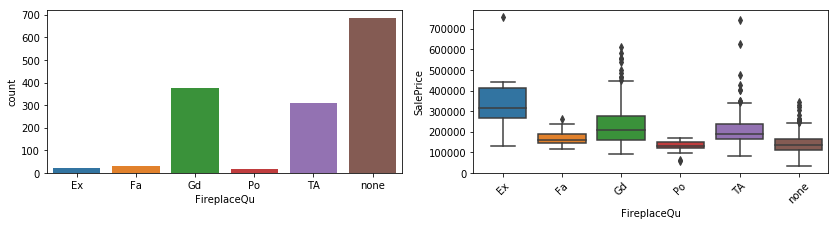
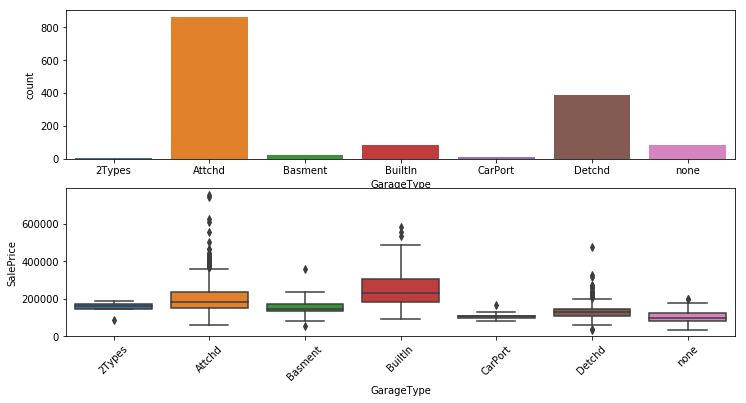
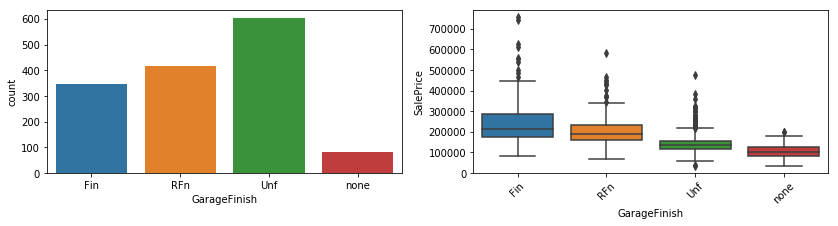
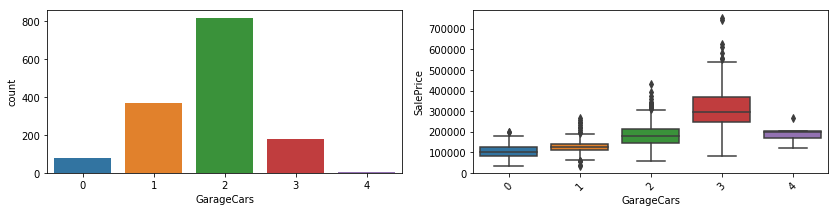
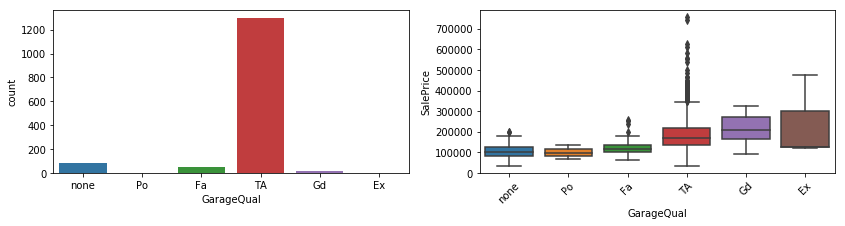
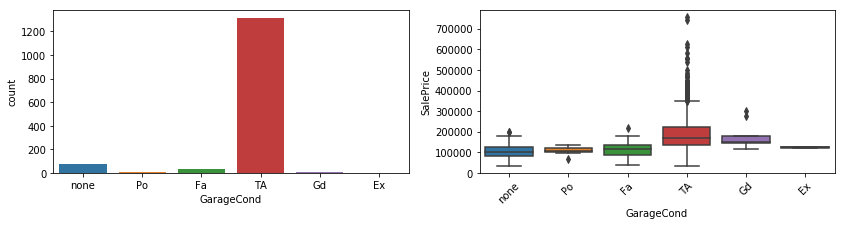
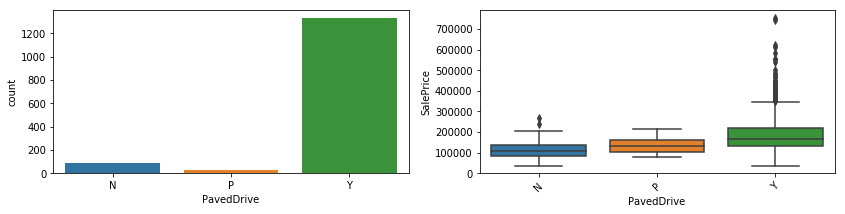
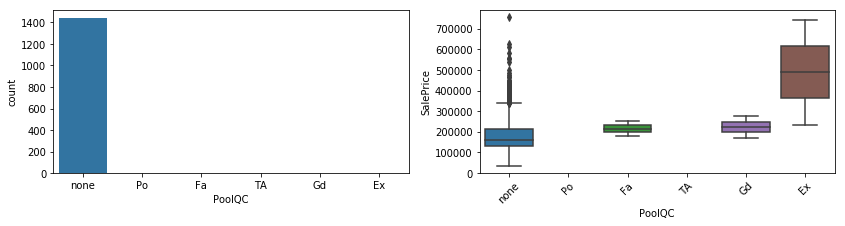
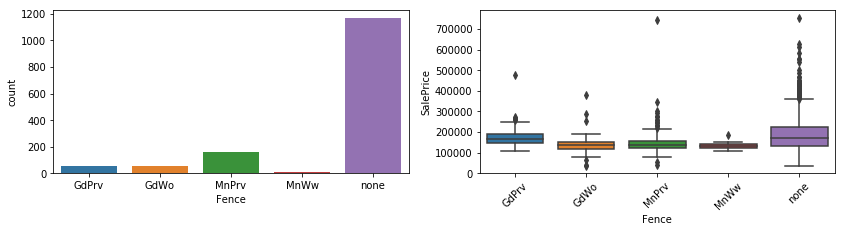
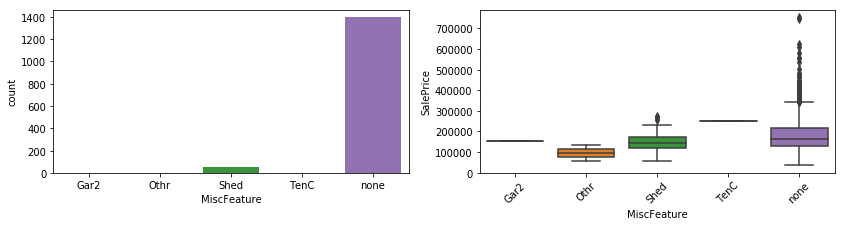
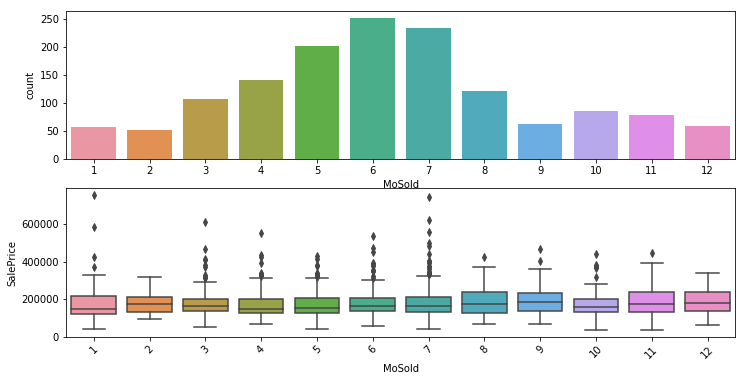
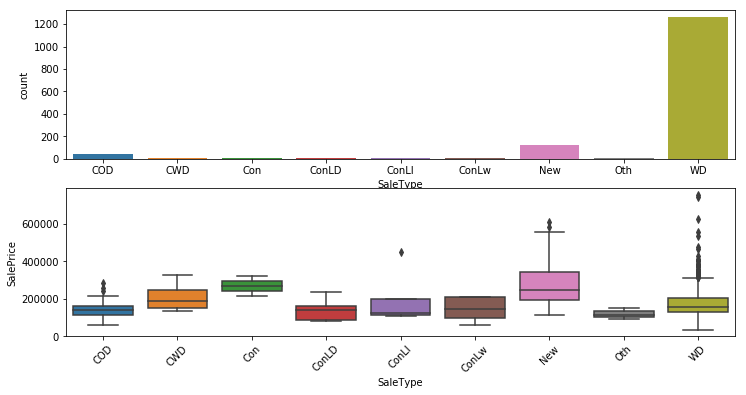
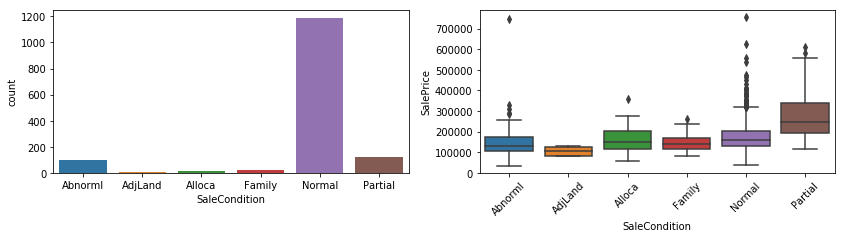
Distribution of SalePrice by Feature
The following plots show the distribution of SalePrice by feature. For example, the first plot is for MSZoning. The green plot shows the distribution of SalePrice filtered for rows where MSZoning = C(all). The green vertical line shows the mean SalePrice of that subset. The means are spread out implying that MSZoning is related to SalePrice.
one_ext = train[train.Exterior1st == train.Exterior2nd].drop(columns = 'Exterior2nd')
two_ext = train[train.Exterior1st != train.Exterior2nd]
c0 = one_ext[['Exterior1st', 'SalePrice']].rename(columns = {'Exterior1st' : 'Exterior'})
c1 = two_ext[['Exterior1st', 'SalePrice']].rename(columns = {'Exterior1st' : 'Exterior'})
c2 = two_ext[['Exterior2nd', 'SalePrice']].rename(columns = {'Exterior2nd' : 'Exterior'})
data_to_plot = pd.concat([c0, c1, c2], axis = 'rows').reset_index()
def count_box_plots(categories):
for category in categories:
if not (category.startswith('Exterior') or category.startswith('Condition')):
data_to_plot = train
elif category == 'Exterior1st':
one_ext = train[train.Exterior1st == train.Exterior2nd].drop(columns = 'Exterior2nd')
two_ext = train[train.Exterior1st != train.Exterior2nd]
c0 = one_ext[['Exterior1st', 'SalePrice']].rename(columns = {'Exterior1st' : 'Exterior'})
c1 = two_ext[['Exterior1st', 'SalePrice']].rename(columns = {'Exterior1st' : 'Exterior'})
c2 = two_ext[['Exterior2nd', 'SalePrice']].rename(columns = {'Exterior2nd' : 'Exterior'})
data_to_plot = pd.concat([c0, c1, c2], axis = 'rows').reset_index()
category = 'Exterior'
elif category == 'Condition1':
one_cond = train[train.Condition1 == train.Condition2].drop(columns = 'Condition2')
two_cond = train[train.Condition1 != train.Condition2]
c0 = one_cond[['Condition1', 'SalePrice']].rename(columns = {'Condition1': 'Condn'})
c1 = two_cond[['Condition1', 'SalePrice']].rename(columns = {'Condition1': 'Condn'})
c2 = two_cond[['Condition2', 'SalePrice']].rename(columns = {'Condition2': 'Condn'})
data_to_plot = pd.concat([c0, c1, c2], axis = 'rows').reset_index()
category = 'Condn'
elif category == 'Exterior2nd' or category == 'Condition2':
continue
print(category)
values = data_to_plot[category].drop_duplicates()
if len(values) > 6:
f, (ax1, ax2) = plt.subplots(2,1, figsize = (12, 6))
else:
f, (ax1, ax2) = plt.subplots(1,2, figsize = (14, 3))
sns.countplot(x = data_to_plot[category].sort_values(),
ax=ax1)
xt = plt.xticks(rotation=45)
sns.boxplot(x = data_to_plot[category].sort_values(),
y = data_to_plot['SalePrice'],
ax=ax2)
xt = plt.xticks(rotation=45)
plt.show()
is_dtype_num = train.dtypes.isin([np.dtype('float64'), np.dtype('int64')])
num_feats = train.dtypes.index[is_dtype_num]
cat_df = train.drop(columns = list(num_feats) + ['GarageYrBlt'])
count_box_plots(cat_df.columns.values)
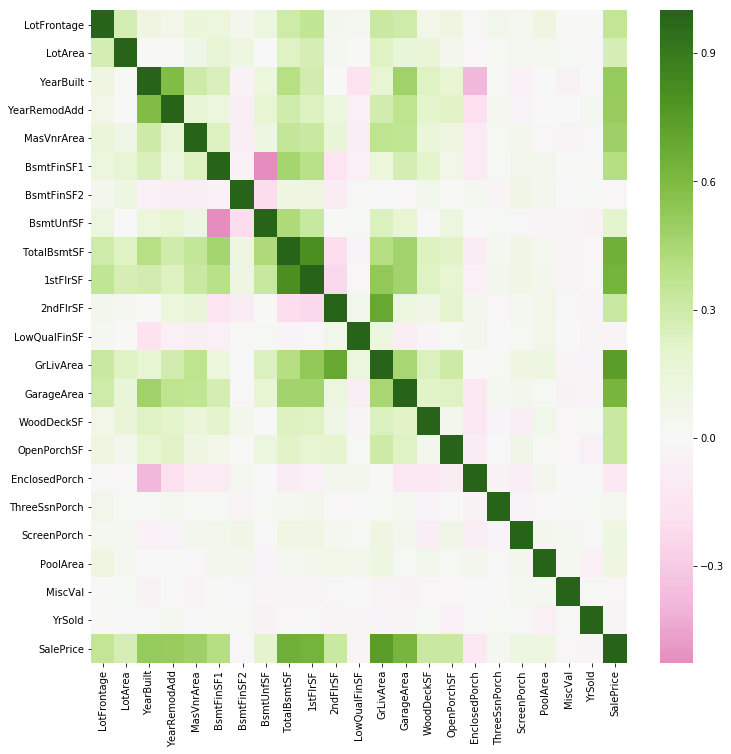
fig = plt.figure(figsize=(12,12))
sns.heatmap(train[num_feats].corr(), center=0, cmap = plt.get_cmap('PiYG'))
MSSubClass
MSZoning
Street
Alley
LotShape
LandContour
Utilities
LotConfig
LandSlope
Neighborhood
Condn
BldgType
HouseStyle
OverallQual
OverallCond
RoofStyle
RoofMatl
Exterior
MasVnrType
ExterQual
ExterCond
Foundation
BsmtQual
BsmtCond
BsmtExposure
BsmtFinType1
BsmtFinType2
Heating
HeatingQC
CentralAir
Electrical
BsmtFullBath
BsmtHalfBath
FullBath
HalfBath
BedroomAbvGr
KitchenAbvGr
KitchenQual
TotRmsAbvGrd
Functional
Fireplaces
FireplaceQu
GarageType
GarageFinish
GarageCars
GarageQual
GarageCond
PavedDrive
PoolQC
Fence
MiscFeature
MoSold
SaleType
SaleCondition
<matplotlib.axes._subplots.AxesSubplot at 0x166295516d8>